
Go Founder Mode with Vilva
Where ideas connect and grow
MindMap your AI chats, notes and knowledge on an infinite canvas.
Check out our quick demo!
Support & Follow Us!

Tired of Scattered Notes and Lost Ideas?
Traditional note-taking tools create silos. Endless documents, disconnected thoughts, and the big picture lost in the details. It's time for a change.
Vilva Helps You See the Connections
Our hierarchical graph structure allows you to visually organize everything from your daily notes to your grandest plans.
Capture, Connect, and Communicate Your Ideas
From brainstorming to execution, Vilva is your single source of truth.
Built for Thinkers Like You
Whatever your passion, Vilva helps you bring it to life.
For Founders
Map your business plan, track investor relations, and connect every aspect of your startup journey.
For Students
Organize your thesis research, connect ideas from different courses, and create a visual study guide.
For Writers
Outline your novel’s plot, develop characters, and keep track of world-building details.
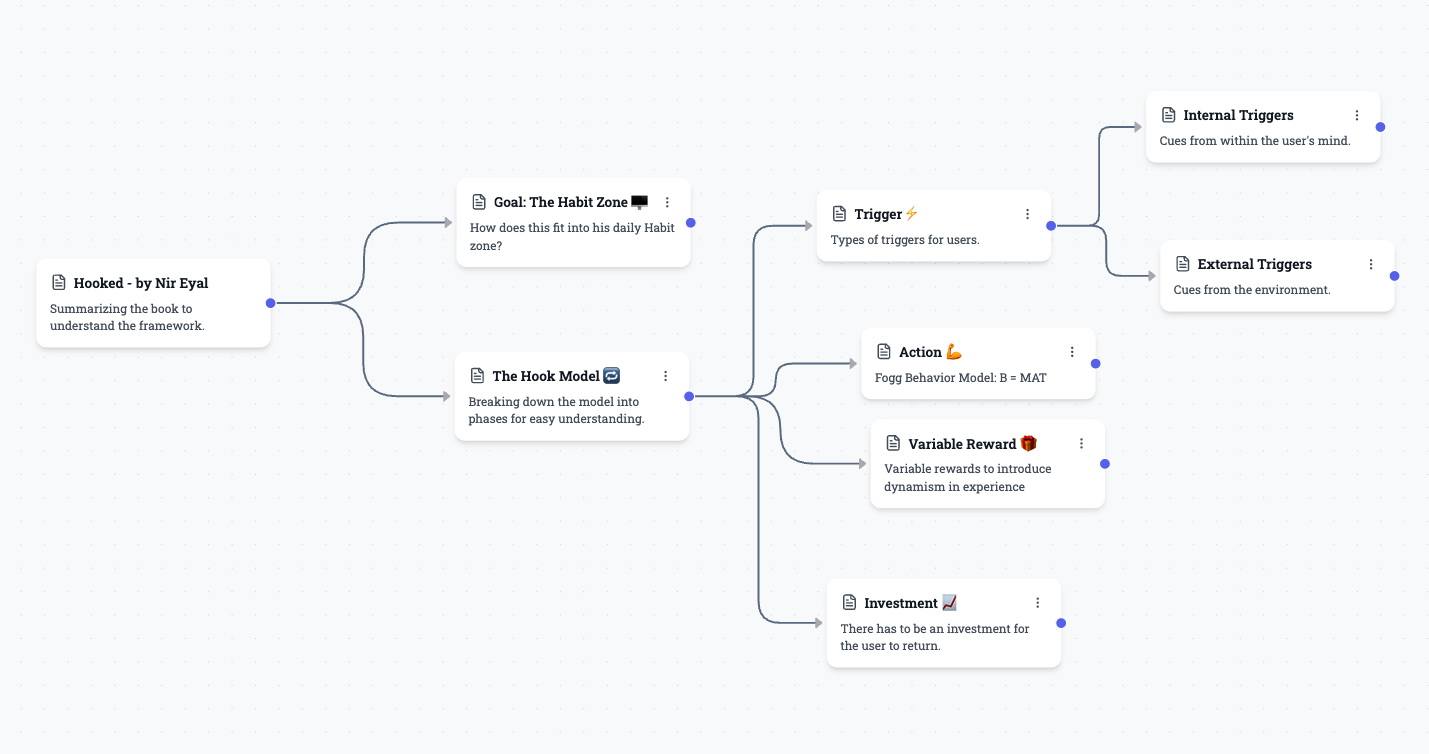
For Developers
Explain a system’s architecture, document codebases, and onboard new team members with visual maps.
"We built Vilva to be the tool we always wanted. A space to think, connect, and build without limits."
Choose Your Plan
Start free and upgrade as you go.
Free
- 5 Workspaces
- 40 Nodes per Workspace
- Visual mind mapping
- AI Powered Graphs
- Direct AI Chat Interface like ChatGPT
- GPT-5, Gemini 2.5 Pro, Claude 3.5 Haiku
- Daily AI Chat token limit
- Team collaboration
Lite
- 20 Workspaces
- 80 Nodes per Workspace
- AI Powered Graphs
- Direct AI Chat Interface like ChatGPT
- GPT-5, Gemini 2.5 Pro, Claude Sonnet 4.5
- Daily AI Chat token limit
- Team collaboration
- Extensive support
Pro
- 50 Workspaces
- 150 Nodes per Workspace
- AI mindmap generation
- Everything in Lite
- Latest Features with higher limits
- Team collaboration
- Priority support
Max
- You're being very nice!
- Unlimited workspaces
- Unlimited chat tokens
- Dedicated support
- AI managed Mission control graphs
- Higher privileges in Vilva Hub
- Highest priority for feature requests
How Can I Use Vilva?
Research Knowledge Management
Organize research papers, experiments, and findings in an interconnected knowledge graph. Track citations, methodologies, and results with AI-powered insights.
Try it now →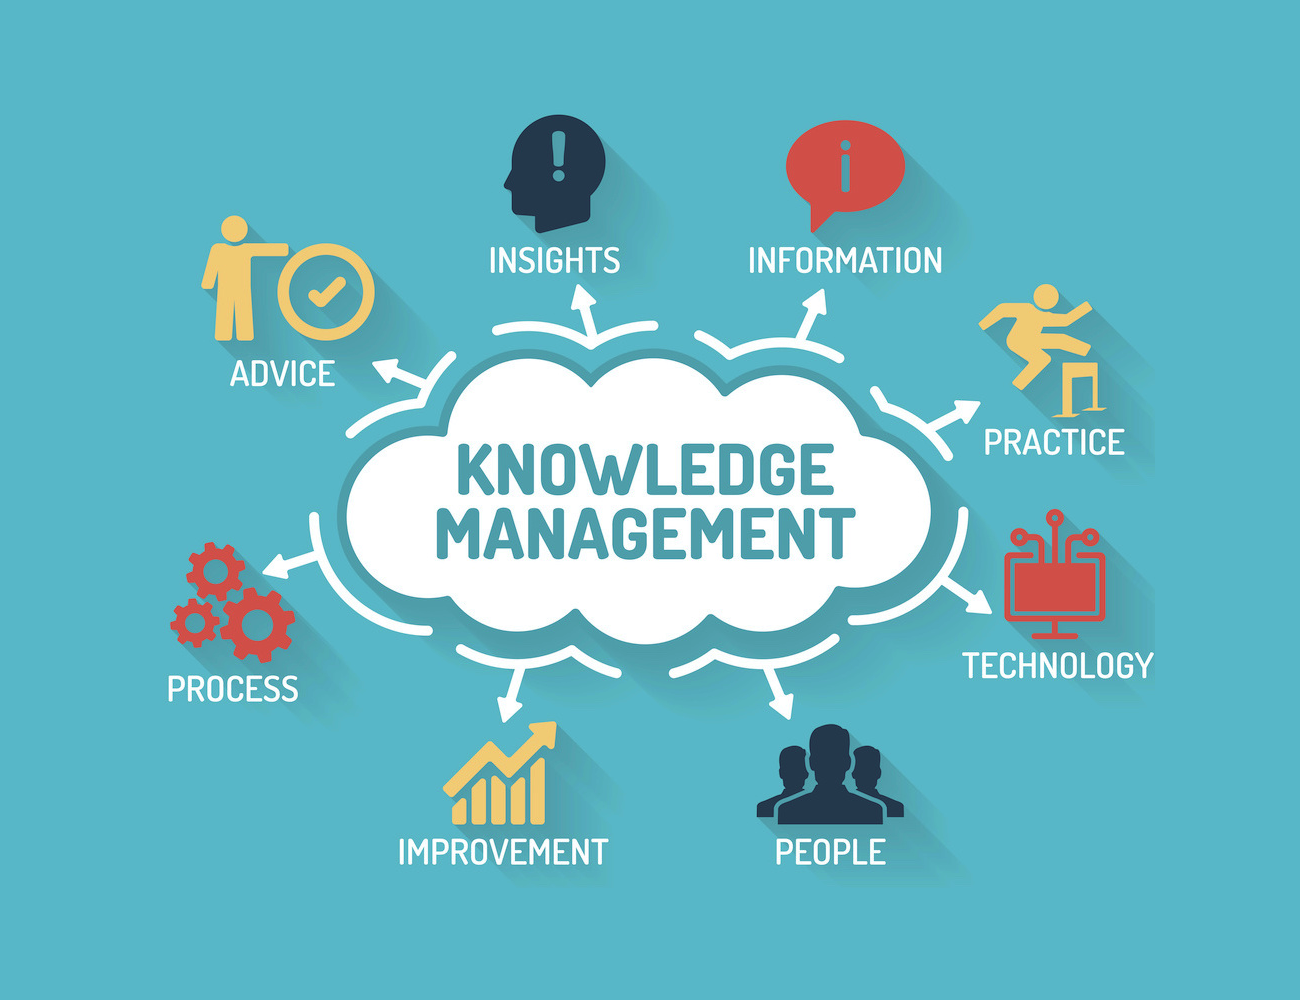
Technical Documentation
Create living documentation for complex systems and architectures. Visualize dependencies, APIs, and system interactions in an intuitive graph format.
Try it now →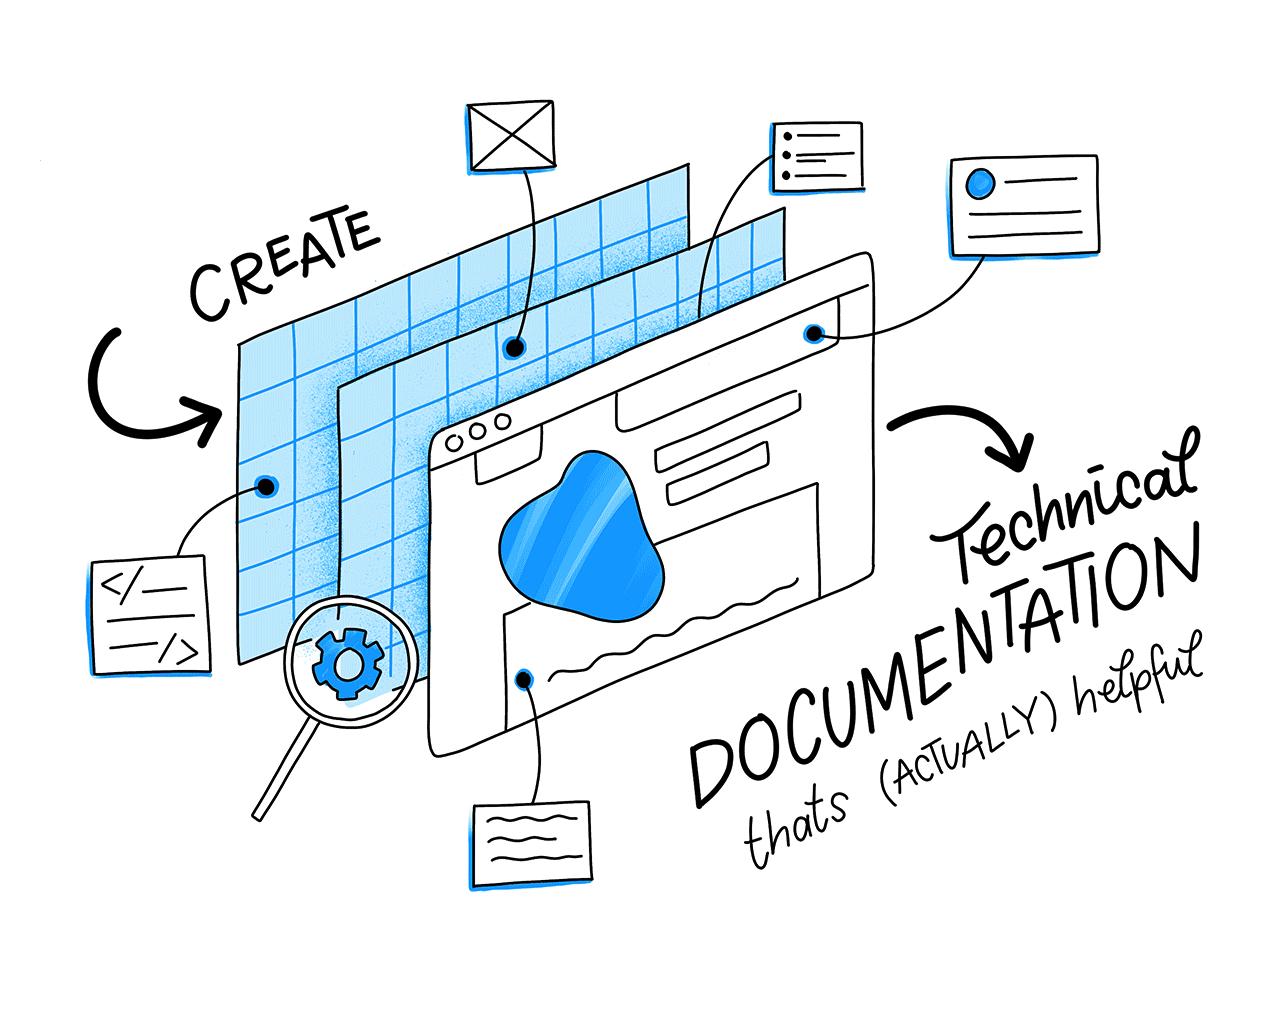
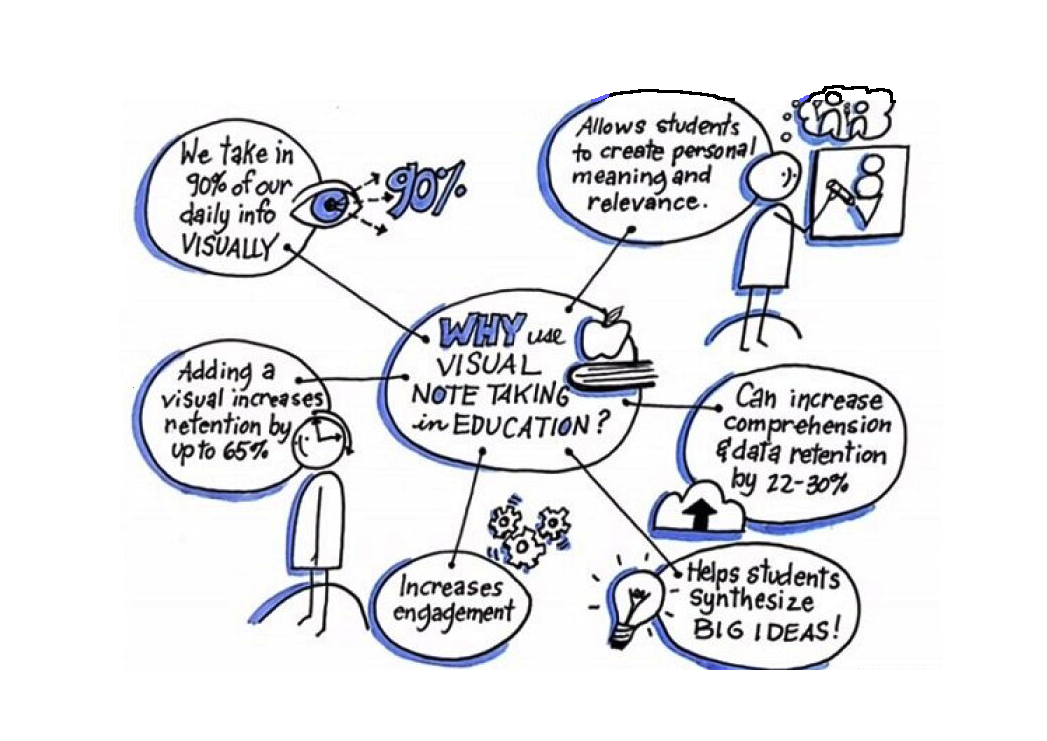
Visual Note-Taking
Transform your notes into a living graphical knowledge base. Create, connect, and enhance your thoughts with AI assistance in a beautiful, minimalist interface.
Try it now →